This web page was produced as an assignment for Genetics 564, an undergraduate course at UW-Madison, Genetics 564
Future research to investigate PSAP and Gaucher Disease
Mutations in PSAP are known to cause Gaucher Disease. It is unknown, however, what factors are responsible for the differences between the server and mild phenotype of Gaucher Disease. I hypothesize that variations in PSAP activity and expression contribute to the differences between the mild and severe phenotype
Aim 1: Whole genome sequencing to find variable regions of genome between mild, server, and control group.
The genomes of three separate groups will be sequencing using illumina next generation sequencing. The three groups will be a control, those with the mild phenotype, and those with the severe phenotype. The genomes of the three groups will be aligned and checked for regions that are constant within the group, but variable between the groups. The hypothetical data in Figure 1 reveals a single nucleotide polymorphism (SNP) that differs between the three groups. If this SNP was located within a few kilobases of PSAP, it is possible that it is involved with the expression of PSAP.
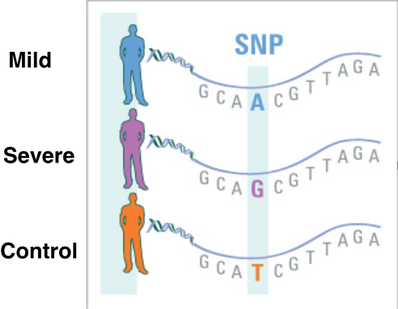
Figure 1: This hypothetical data reveals a SNP that differs between the three groups.
Aim 2: Identify the phosphorylated amino acids of PSAP in mild, severe, and control groups.
Using the same three groups from aim number one, mass spectrometry will be used to determine the phosphorylated amino acids of PSAP. The predicted phosphorylation sites, using NetPhos 2.0 server, of the wild-type protein can be seen in figure 2. If differences in the phosphorylation sites between the three groups are identified, it may be a factor in PSAP activity. Different phosphorylation sites will be tested for their disease relevance using CRISPR/ Cas 9 and the mouse model organism. For example, if the control group and mild phenotype are found to have a phosphorylated serine that is not phosphorylated in the server phenotype. CRISPR/ Cas 9 will be used to create a transgenic mouse that encodes a glutamic acid instead of serine. If the resulting phenotype is found to have severe symptoms, this amino acid may an important factor that contributes to disease severity.
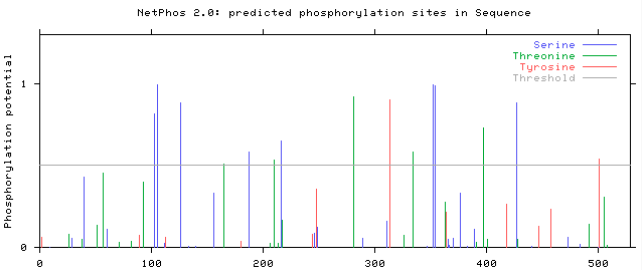
Figure 2: The predicted phosphorylation sites of PSAP using NetPhos 2.0.
Aim 3: Compare tissue specific levels of PSAP and GBA expression in GD patients.
Using illumina RNA sequencing, the relative amount of PSAP and GBA mRNA will be measured in GD patient tissues that exhibit variability in symptoms. The amount of expression will also be compared to a control group of people without GD. Figure 3 shows hypothetical data of liver tissue for the three groups: severe phenotype, mild phenotype, and control. These results reveal that the server phenotype is expressing less PSAP and GBA compared to mild and control groups. The lower expression may account for differences in symptoms and further tested can be done in mice to change the expression of PSAP and GBA to confirm this conclusion.
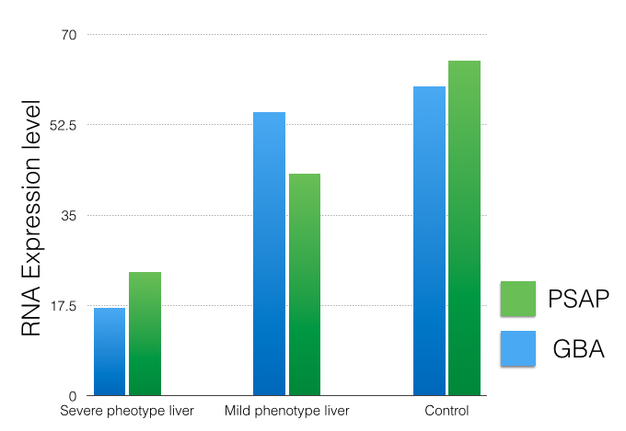
Figure 3: Hypothetical data reveals the relative amount of PSAP and GBA RNA in the liver of GD patients.
Future directions
The discovery that PSAP expression and activity plays a role in the severity Gaucher Disease symptoms would illuminate one of the mysteries of the disease. This may eventually lead to the clinical improvements via the development of therapies to modify PSAP levels in patients.
| rough_draft_final_presentation_psap.pdf |
| rough_draft_final_presentation_psap.pptx |
| rough_draft_final_presentation_psap.key |
| draft_2_final_presentation_psap_copy.key |
| draft_2_final_presentation_psap_copy.pdf |
| final_presentation_psap_.pdf |
| final_presentation_psap_.key |
